Q1 2026 was the first quarter where growth felt steady and repeatable.
TL;DR
Compared to Q4 2025, growth accelerated across traffic, signups, and revenue, while monetization improved at the same time.
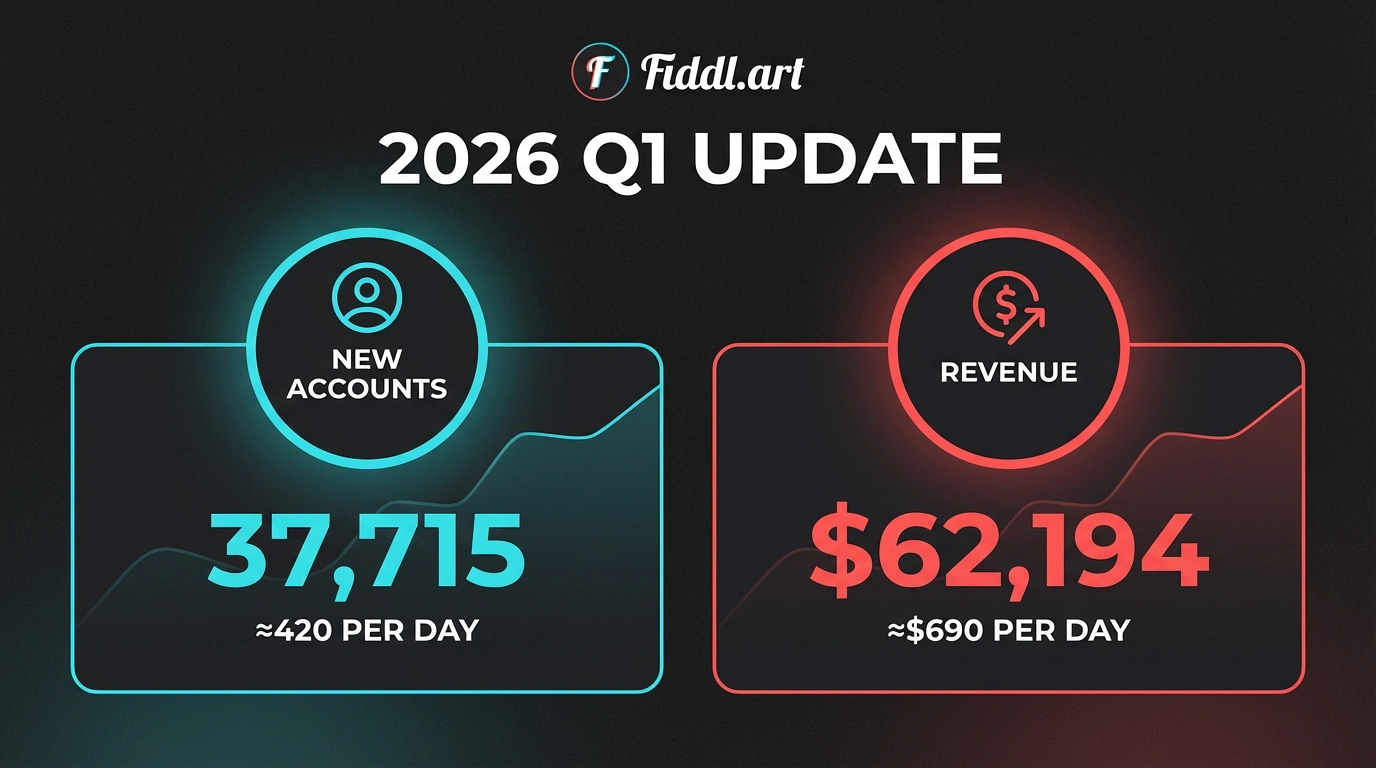
For Q1 2026 (quarter totals):
- 114,003 visits (~1,250 per day)
- 37,715 new accounts (~420 per day)
- $62,194 revenue (~$690 per day)
The Numbers
Quarter-over-quarter (Q1 vs Q4):
- Sessions (visits): 26,570 → 114,003
- Signups (new accounts): 8,994 → 37,715
- Revenue (cash): $7,647 → $62,194
- Paying users: 227 → 1,337
Conversion remained stable at ~33% even as traffic scaled.
Average session duration increased from 376 seconds to 445 seconds, showing stronger engagement.
Revenue
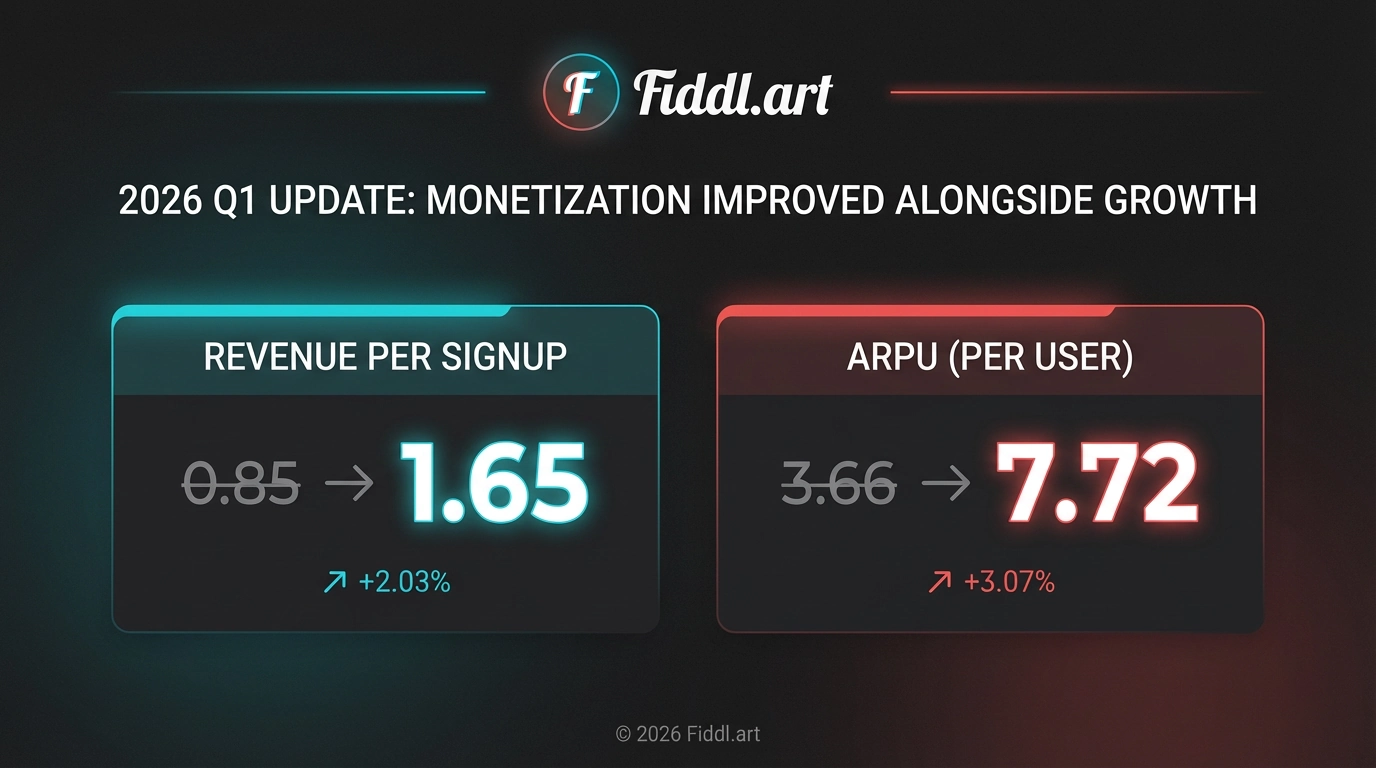
Monetization improved alongside growth.
- Revenue per signup: $0.85 → style=background:#121212.65
- ARPU (per user): $3.66 → $7.72
- ARPPU (per paying user): $33.69 → $46.52
Subscriptions were introduced in Q1 and generated $5,385 during the quarter.
Traffic
Traffic sources became more balanced.
Direct and organic traffic grew the most, while paid channels declined slightly. This shift suggests more users are arriving with intent or returning on their own.
Search also became a meaningful acquisition channel, with large increases in both clicks and impressions during the quarter.
Usage
User behavior expanded beyond initial experimentation.
In Q4, usage was concentrated on a small number of models. In Q1, activity spread across a broader set of models and video tools.
Example (quarter totals):
- Kling video generations: 477 → 3,172
This reflects more exploration and repeat usage across the platform.
What’s Next
- Improve the path from signup to first successful creation
- Continue investing in organic growth
- Improve retention through onboarding and missions
- Keep shipping consistent product improvements
Growth in Q1 came from many small improvements compounding over time. That approach will continue into Q2.